The charts below reveal crucial outcome data about student well-being, academic performance, and attendance across various ethnic groups. These findings underscore our responsibility to provide every student with the necessary support and opportunities to succeed.
By examining these disparities with an equity lens, we aim to foster discussions and actions that promote a more just educational environment. Let this information motivate us to enhance our efforts in ensuring that all students in Santa Cruz County Schools receive the education they deserve.
The data tell a consistent story: outcomes improved in some areas over time, but large gaps by race/ethnicity persist across academics, engagement, discipline, and wellbeing. Graduation rates are high overall, yet Hispanic/Latino students remain lowest while Asian and White students are highest; CAASPP Math and ELA show even larger, longstanding achievement gaps (with Asian and White students consistently outperforming Black and Hispanic/Latino students, and no meaningful narrowing after testing resumed). Attendance worsened sharply during the pandemic years—chronic absenteeism rose dramatically for every group, with Hispanic/Latino and African American students experiencing the highest rates—then improved in 2023–24 and 2024–25, though not back to pre-spike levels for most groups. Discipline disparities remain: suspension rates are consistently highest for African American and Hispanic/Latino students and lowest for Asian students. Student wellbeing indicators also reflect inequity and a pandemic-era strain—reported chronic sadness/hopelessness and suicidal ideation peak in 2021 (and for some groups in 2023) and decline by 2025, but unevenly across groups—underscoring the need for sustained, targeted supports alongside systemwide improvement.

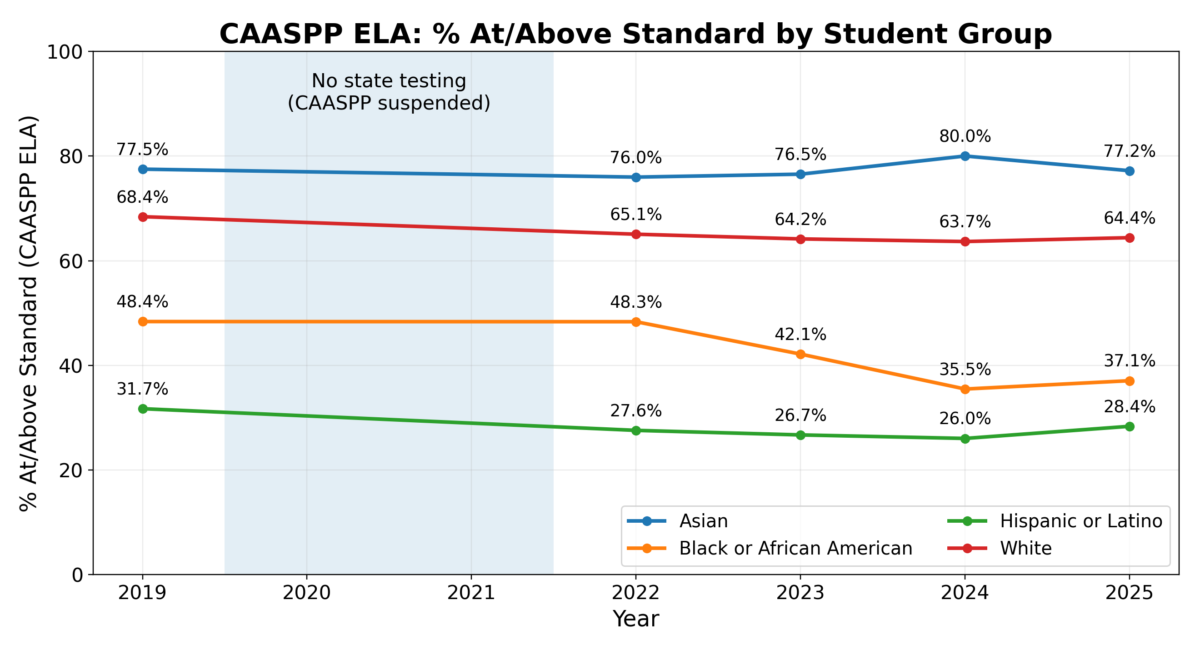
State Assessments: Language Arts
Across the years shown (with no CAASPP testing in 2020–2021), the overall pattern is stability at the top and persistent gaps at the bottom. Asian students remain highest throughout, while White students are consistently next, with a slight decline after testing resumes and a small uptick by 2025. Black and Hispanic/Latino students remain lowest; Black students show the biggest drop from 2019 into the post-pandemic years, while Hispanic/Latino results stay low with only modest improvement by 2025. Overall, the rank order doesn’t change and the achievement gap remains large and largely unchanged over time.
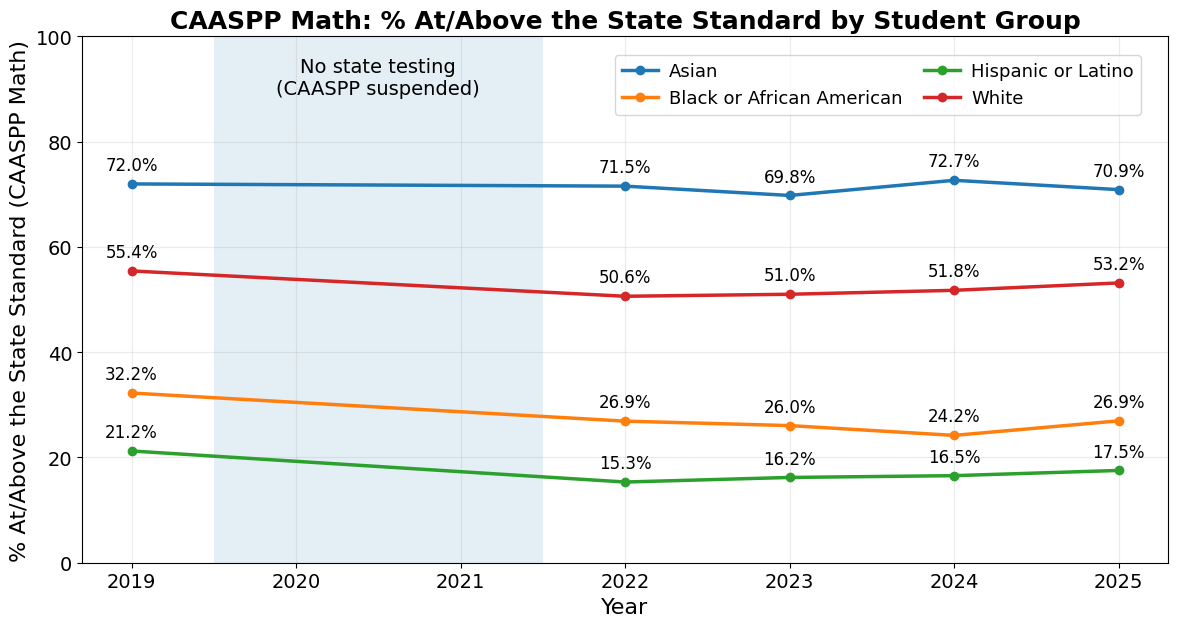
State Assessments: Mathematics
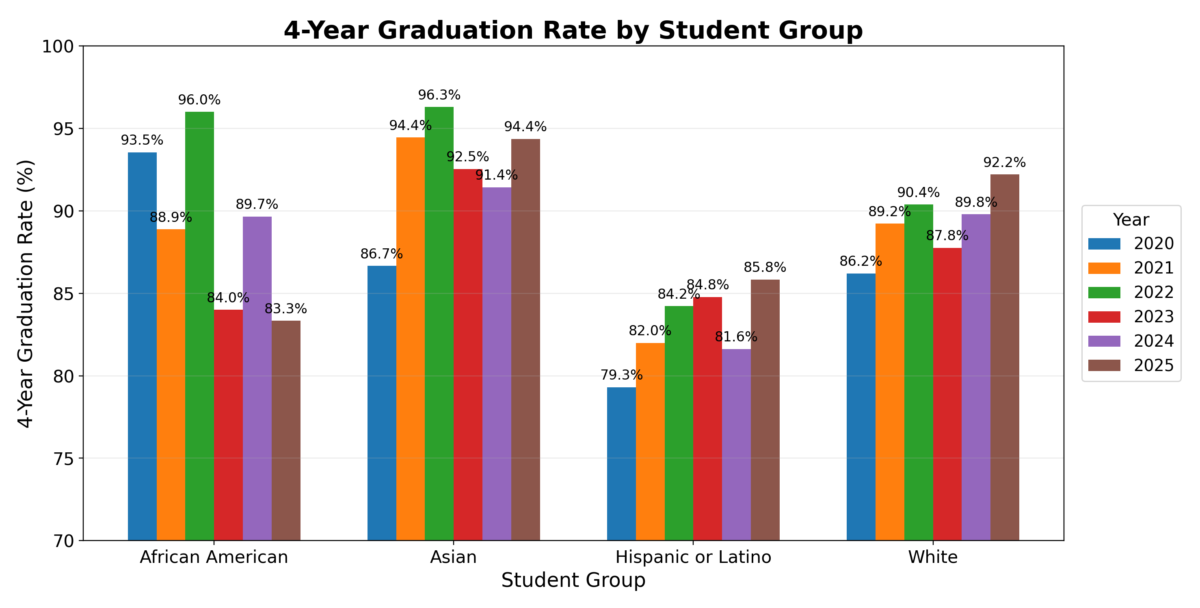
4 Year Graduation Rate
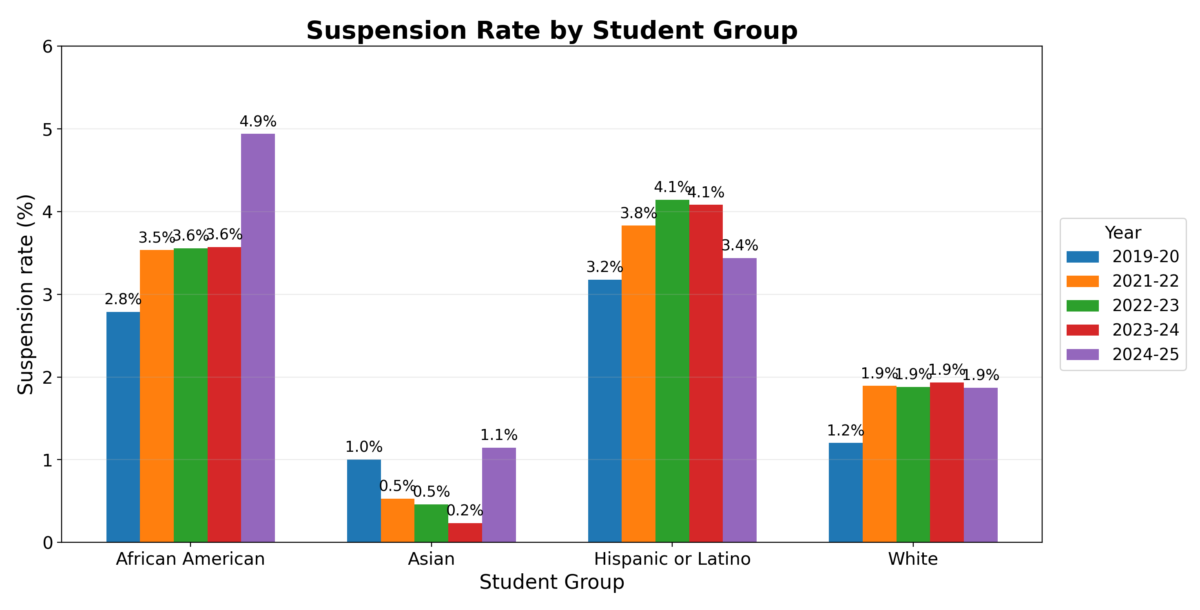
Suspension Rates
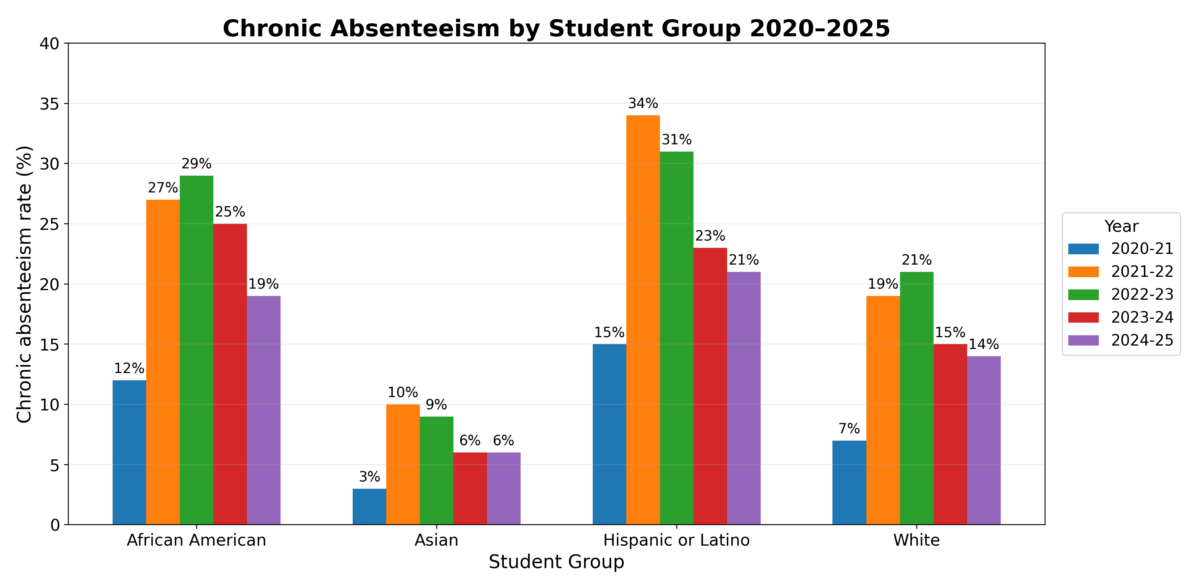
Engagement: Chronic Absenteism
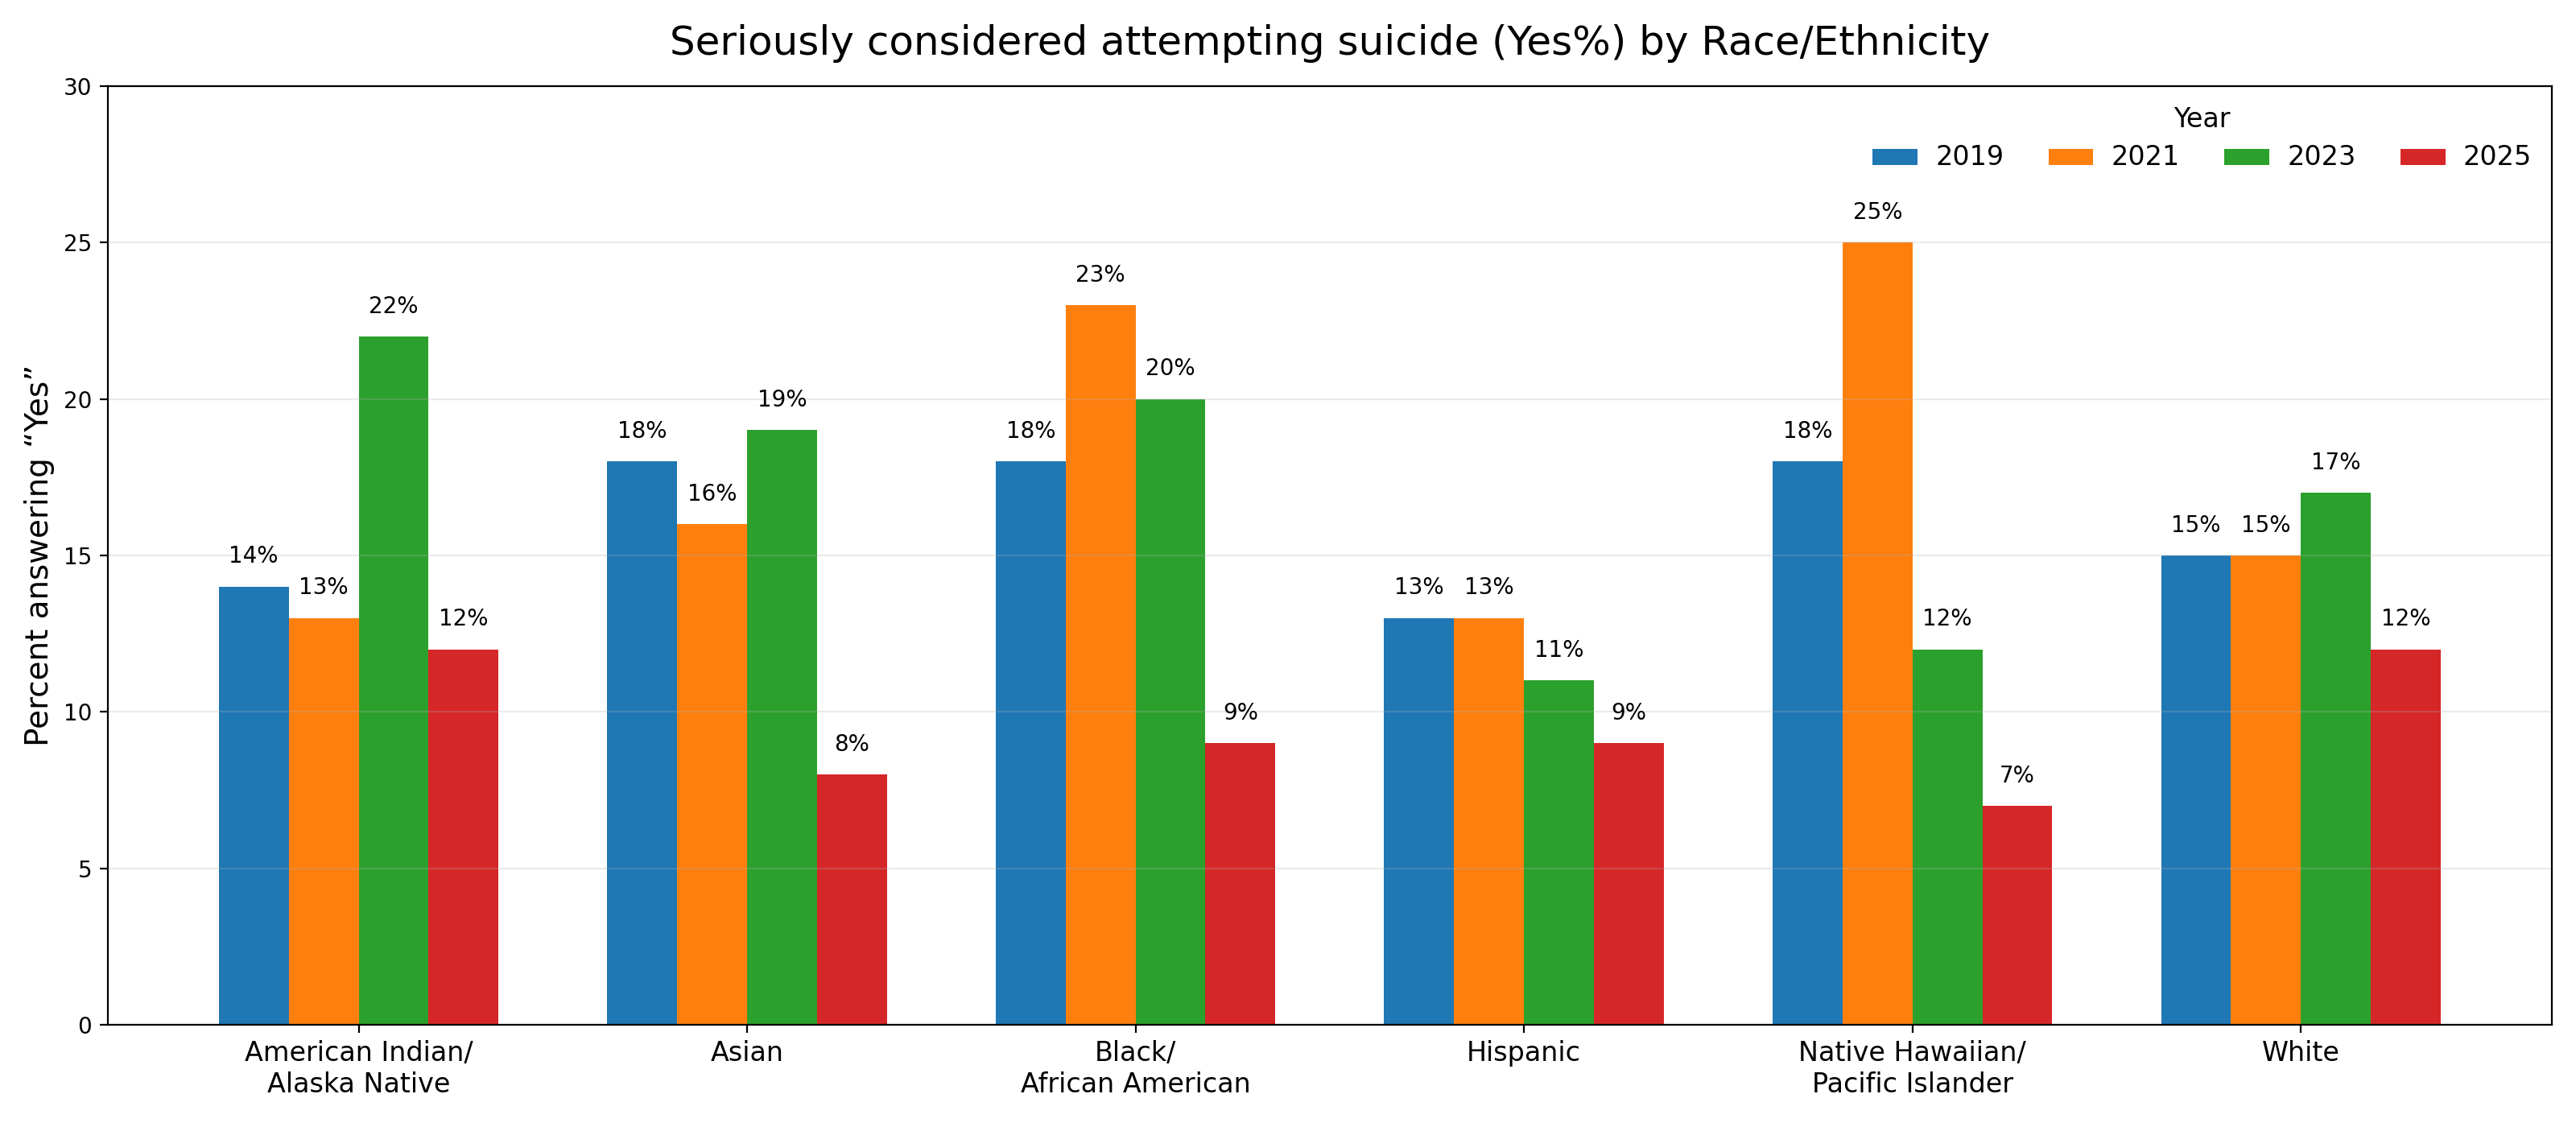
CHKS Survey: Consider Suicide
This chart details responses from the California Healthy Kids Survey concerning students' considerations of suicide over several years, segmented by ethnicity. The data underscores a troubling but important issue: a consistent minority of students across all groups reported having seriously considered attempting suicide. Across race/ethnicity, the percentage of students who seriously considered attempting suicide is generally higher in 2019–2023 and drops in 2025 for every group. Several groups peak earlier: Native Hawaiian/Pacific Islander reaches the highest level in 2021 (25%) before falling to 7% in 2025; Black/African American peaks in 2021 (23%) and declines to 9% in 2025; American Indian/Alaska Native peaks in 2023 (22%) and drops to 12% in 2025. Asian students decline from 18–19% (2019–2023) to 8% (2025), while White decreases from 15–17% down to 12%. Hispanic is comparatively lower and steadier overall (13% → 13% → 11% → 9%).
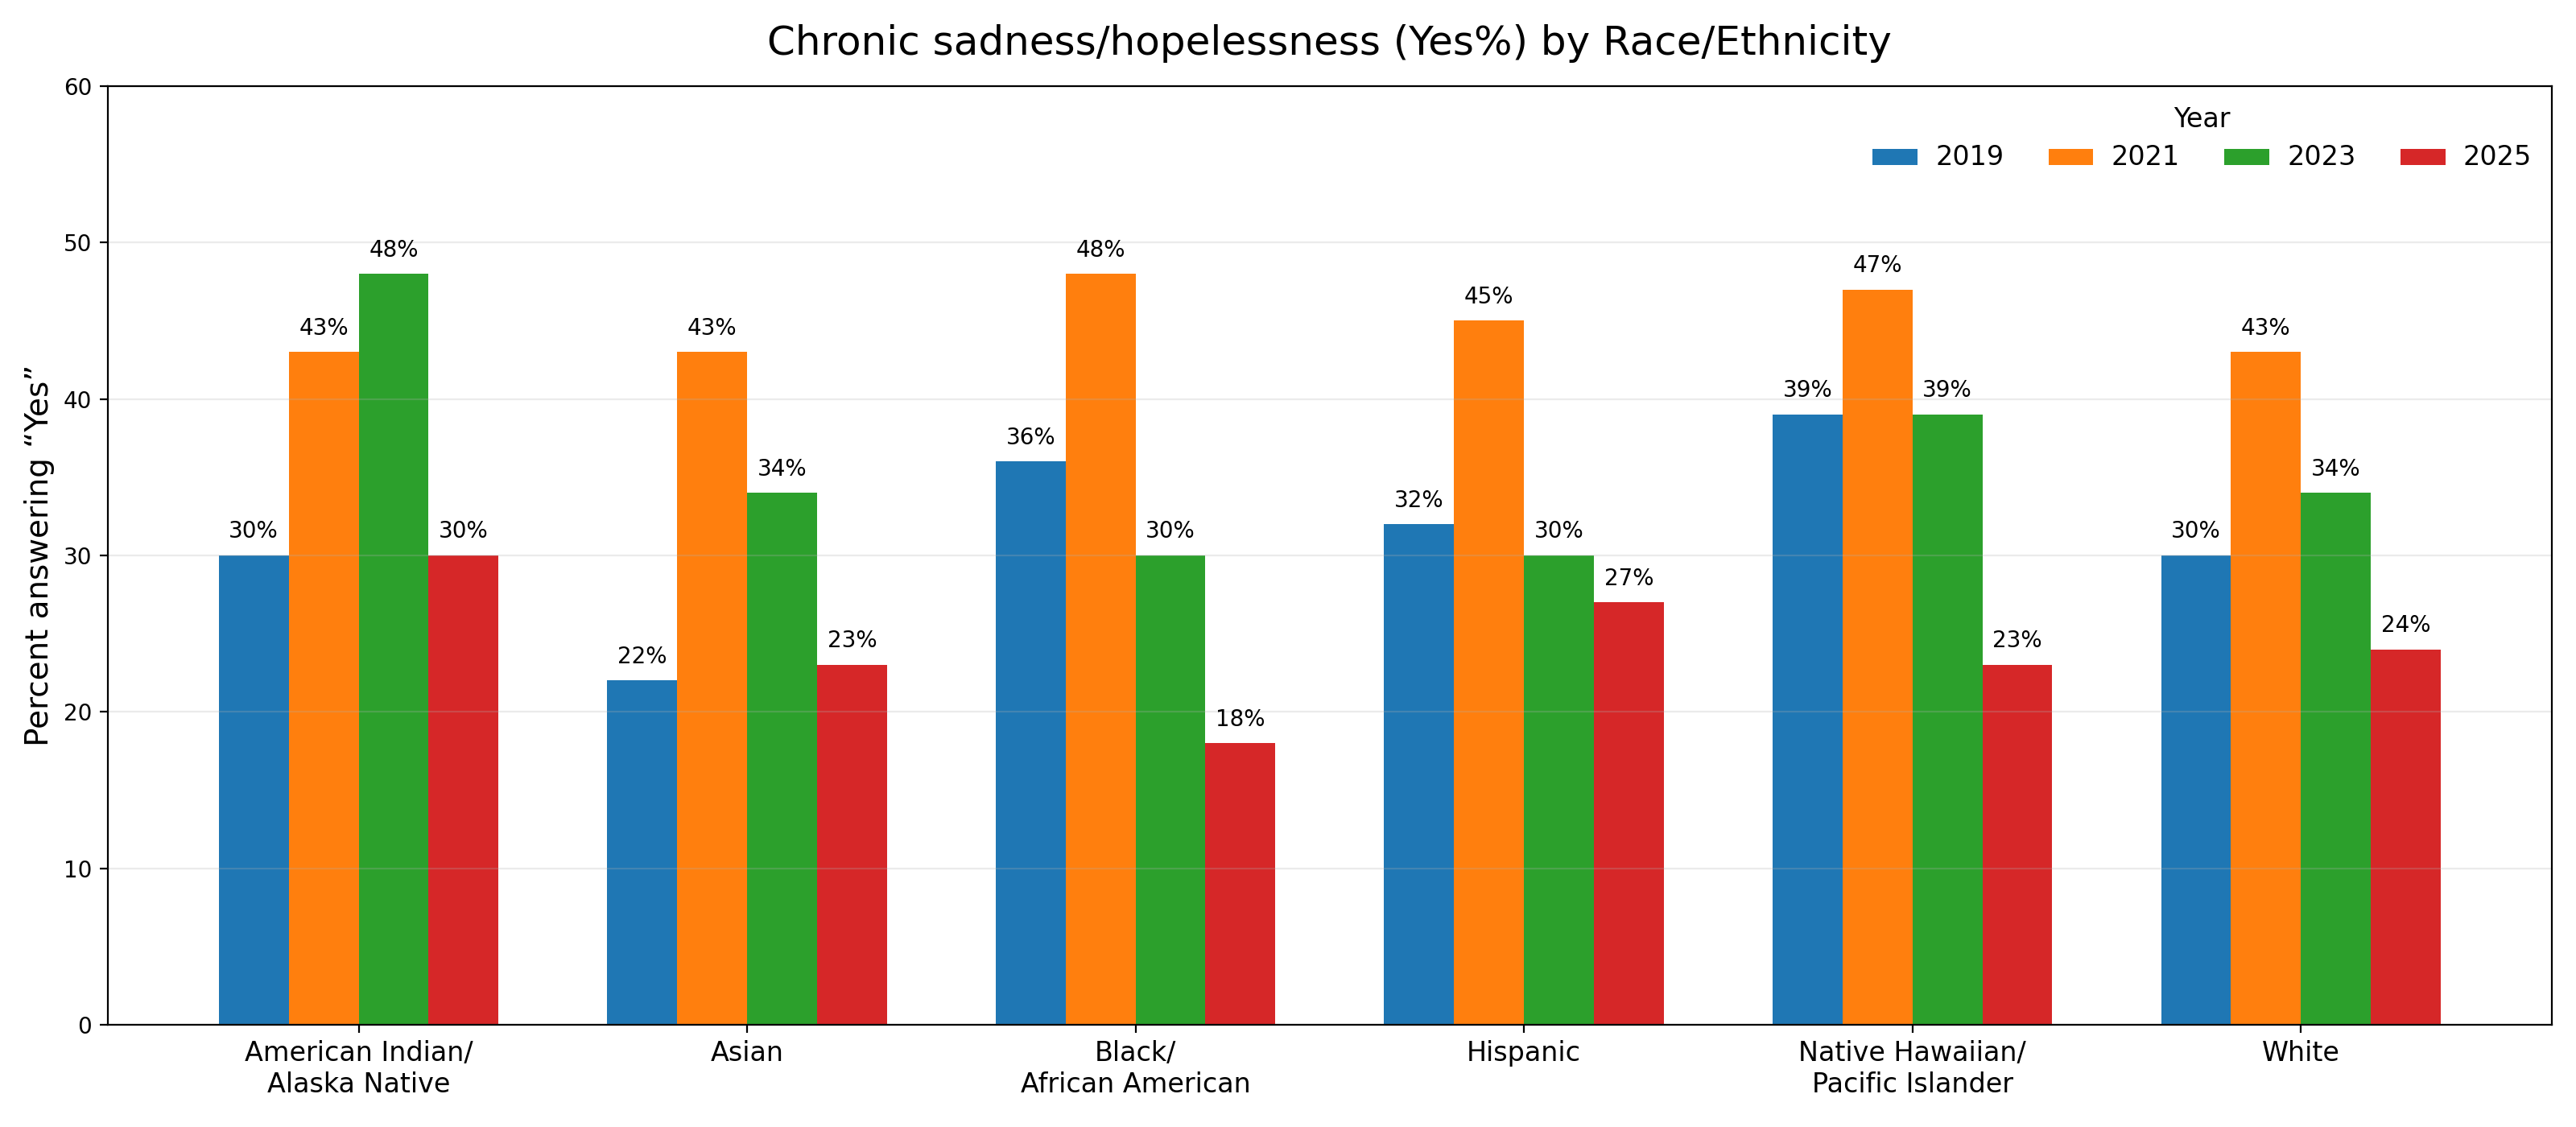
CHKS Survey: Feeling Sad or Hopeless
This chart provides a visual breakdown of the responses to a key mental health indicator from the California Healthy Kids Survey, focusing on the frequency of feelings of sadness or hopelessness among students from various ethnic backgrounds over several years.Across all racial/ethnic groups, reports of chronic sadness/hopelessness generally peaked in 2021 and then declined by 2025. In 2021, “Yes” rates were highest across the board—about 43% for American Indian/Alaska Native, Asian, and White, 45% for Hispanic, 47% for Native Hawaiian/Pacific Islander, and 48% for Black/African American. By 2025, rates dropped substantially for most groups: Black/African American (18%) was lowest, Asian (23%) and NH/PI (23%) were similar, White (24%) and Hispanic (27%) remained somewhat higher, and American Indian/Alaska Native (30%) was highest. Overall, the data show broad improvement after 2021, though differences between groups persist in 2025.