Understanding student Outcomes through an Equity Lens
The charts below reveal crucial outcome data about student well-being, academic performance, and attendance across various ethnic groups. These findings underscore our responsibility to provide every student with the necessary support and opportunities to succeed.
By examining these disparities with an equity lens, we aim to foster discussions and actions that promote a more just educational environment. Let this information motivate us to enhance our efforts in ensuring that all students in Santa Cruz County Schools receive the education they deserve.
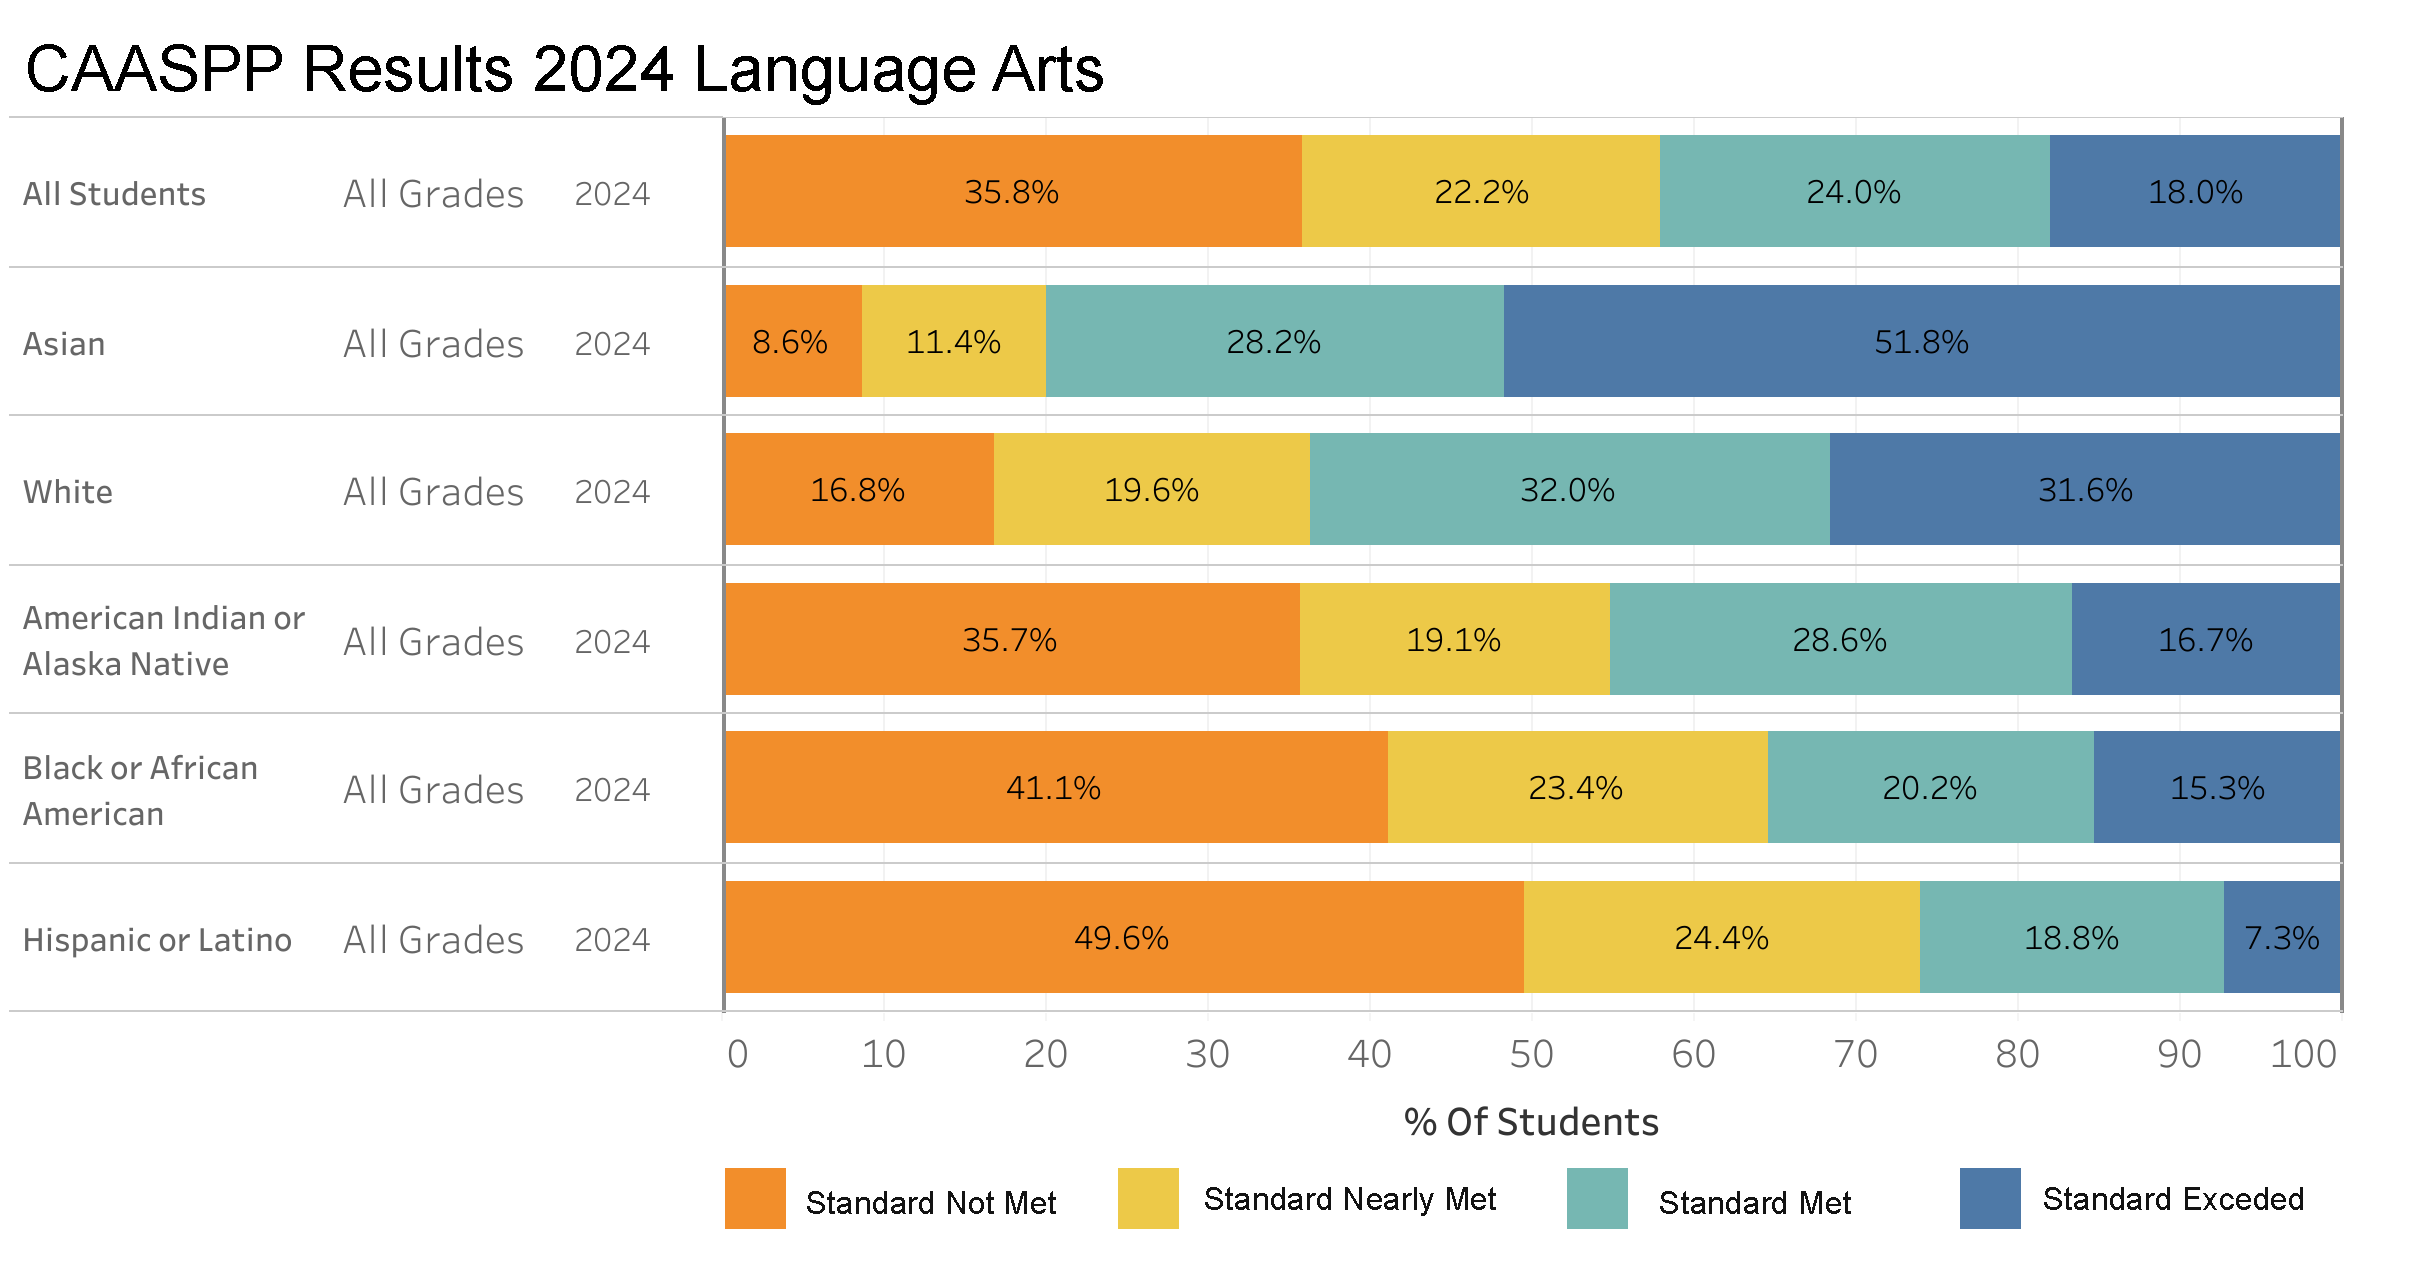
State Assessments: Language Arts
This bar chart displays the 2024 CAASPP results for Language Arts, categorized by different ethnic groups and their achievement levels: Standard Not Met, Standard Nearly Met, Standard Met, and Standard Exceeded. It illustrates a varied performance across groups, with Asian students notably excelling as more than half exceeded the standard. In contrast, Hispanic or Latino students have a higher percentage nearly meeting the standard, indicating a significant potential for improvement. The chart highlights the diverse educational outcomes and underscores the importance of targeted support and resources to enhance language arts proficiency across all groups, aiming to reduce disparities and foster academic success.
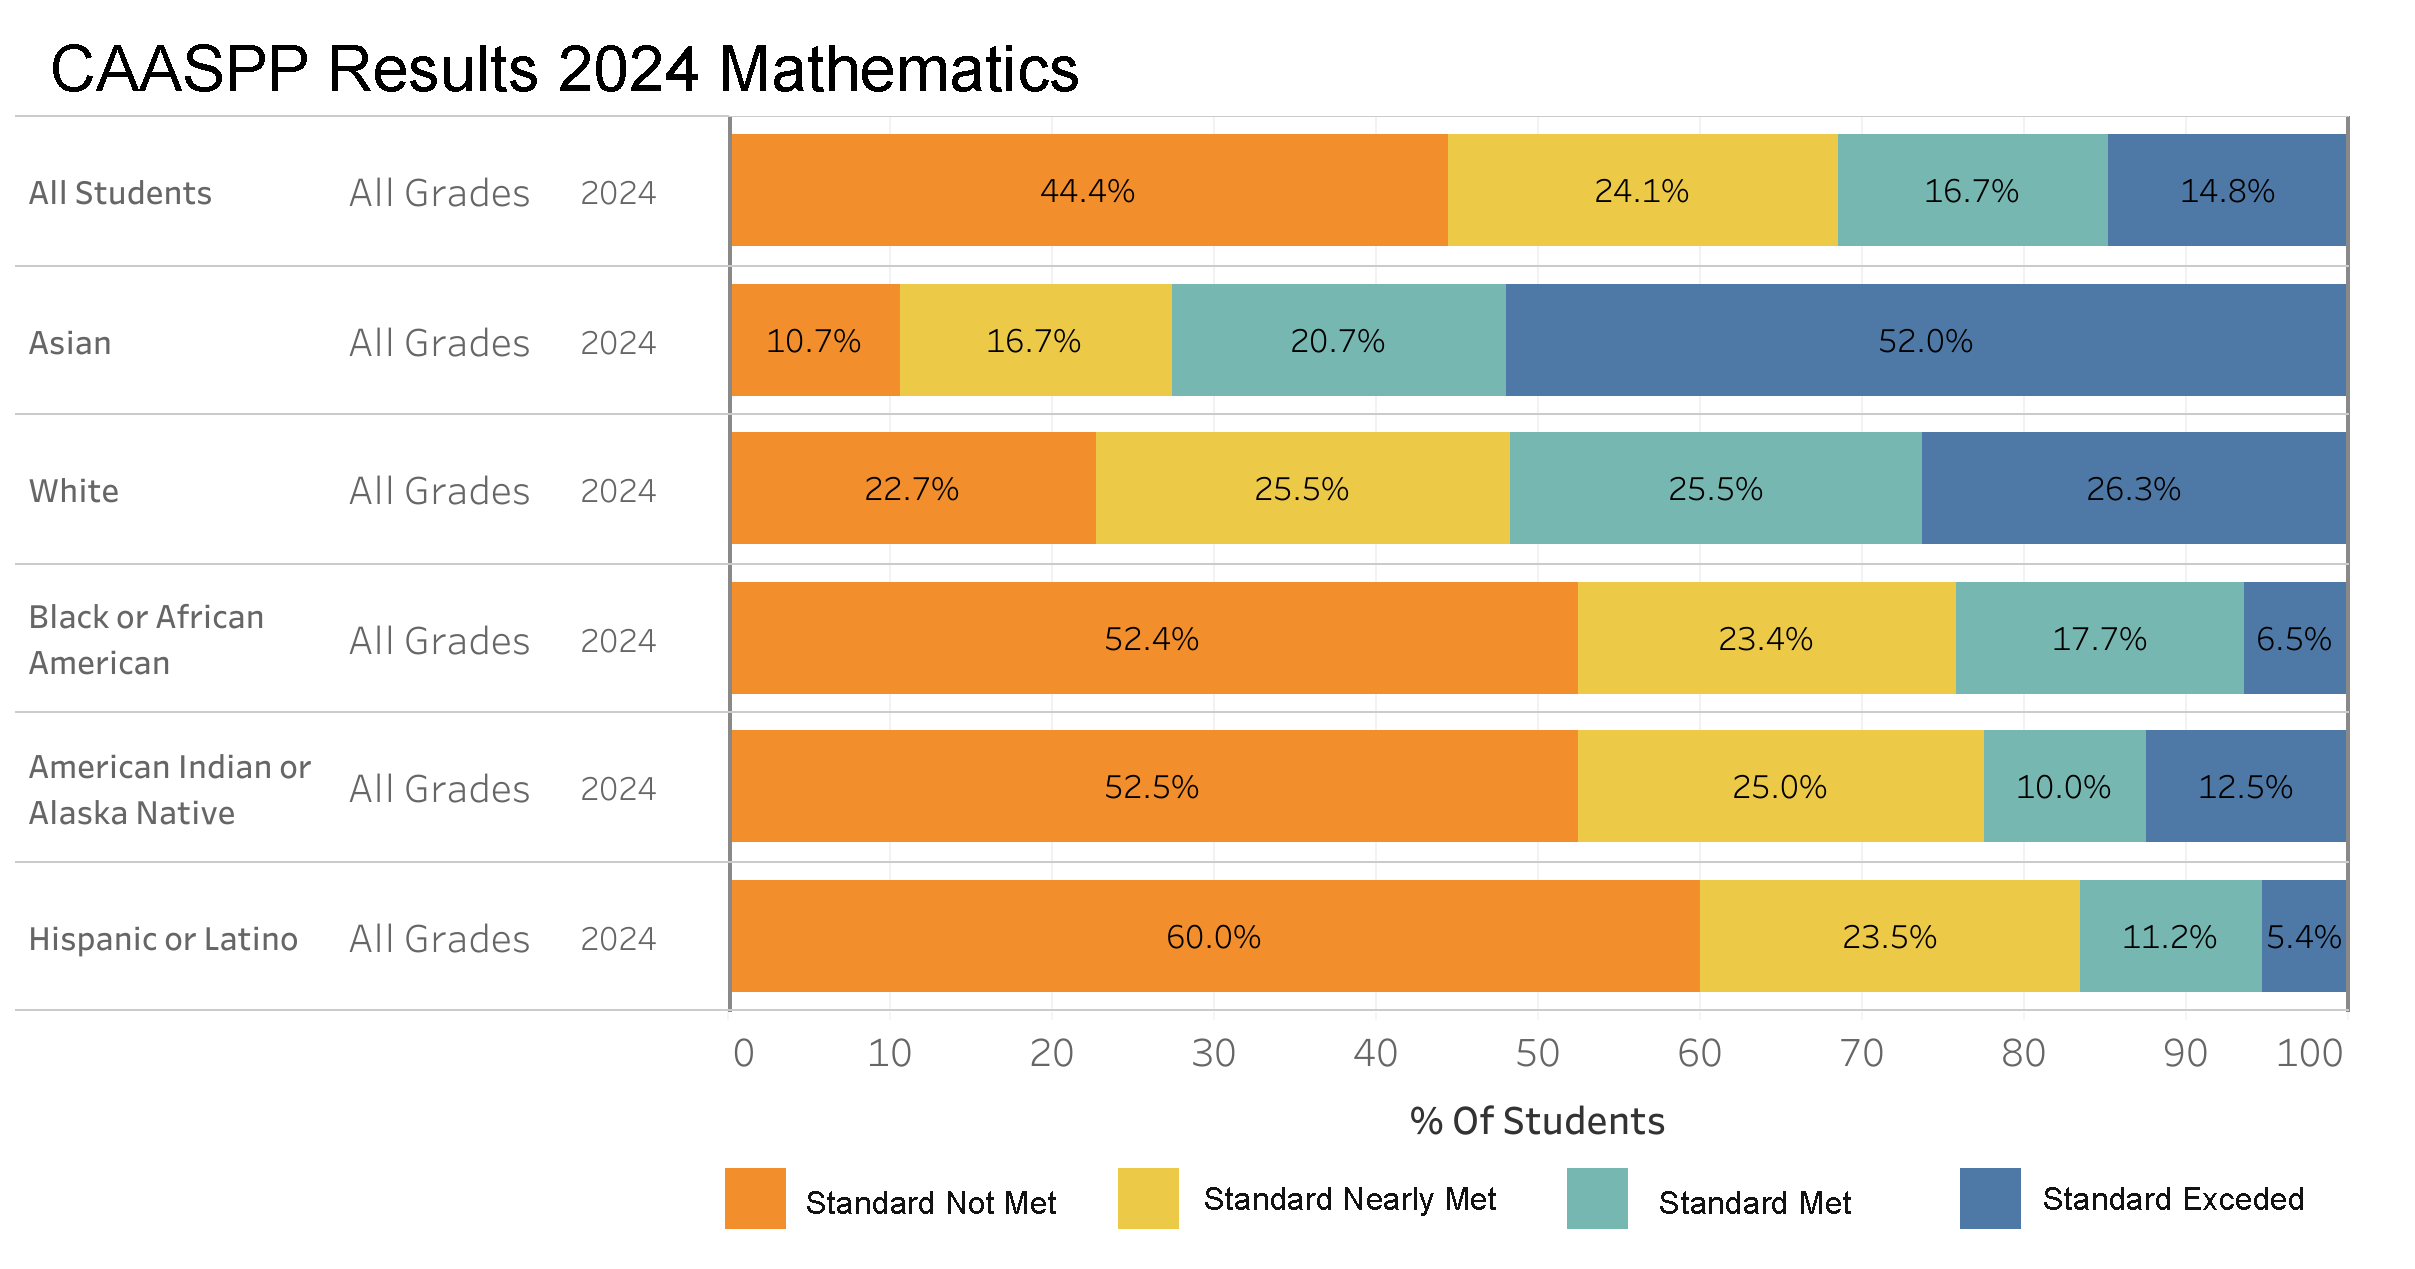
State Assessments: Mathematics
This bar chart displays the 2024 CAASPP Mathematics results, detailing student performance across different ethnic groups, segmented into four categories: Standard Not Met, Standard Nearly Met, Standard Met, and Standard Exceeded. The chart reveals considerable variability in mathematics proficiency among the groups. Notably, a significant proportion of Asian and White students met or exceeded the standards, with Asian students having a slightly higher rate of exceeding. In contrast, Black or African American and American Indian or Alaska Native students show a larger percentage nearly meeting the standard, which highlights the need for additional support to help these students reach higher proficiency levels. This data is essential for educators and policymakers to understand educational disparities and to drive efforts aimed at improving math education for all student groups.
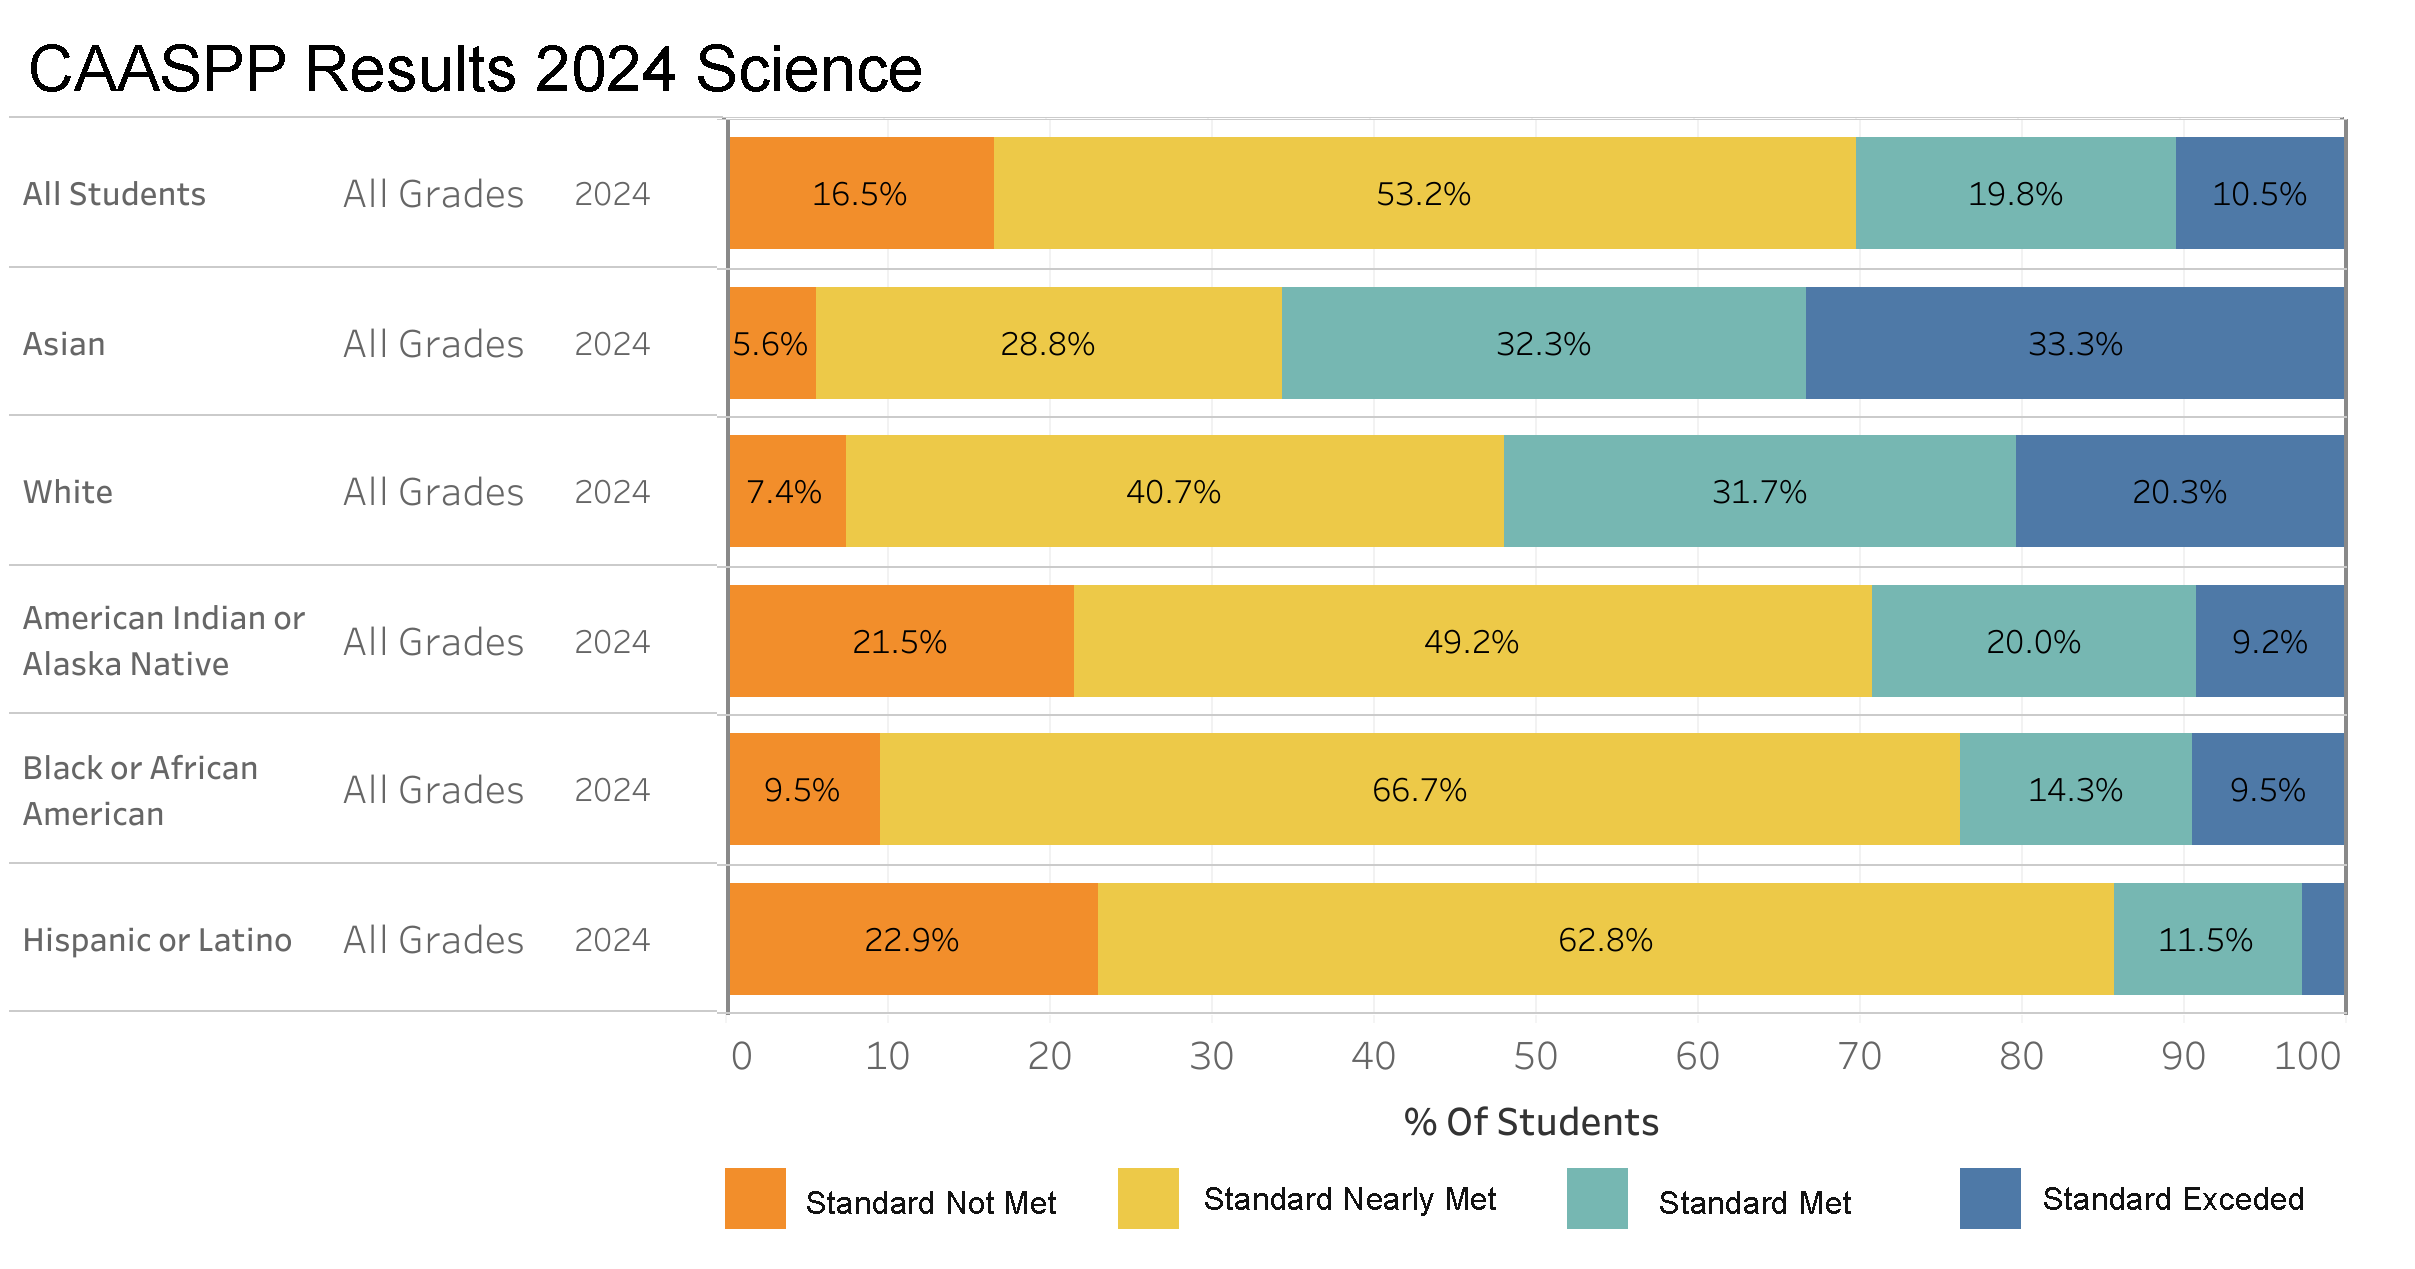
State Assessments: Science
This bar chart represents the performance of various student groups on the 2024 CAASPP Science test, broken down by achievement levels: Standard Not Met, Standard Nearly Met, Standard Met, and Standard Exceeded. The data reveals a diverse range of outcomes among different ethnicities, highlighting both areas of strength and opportunities for targeted improvement. Asian students lead in surpassing the standards, whereas Hispanic or Latino, and Black or African American students show substantial proportions nearly meeting the standards, indicating potential for educational advancements with focused support. This analysis is crucial for educators and policymakers as it underscores the need to tailor educational strategies and resources to meet the specific needs of each student group to enhance their scientific literacy and overall academic success.
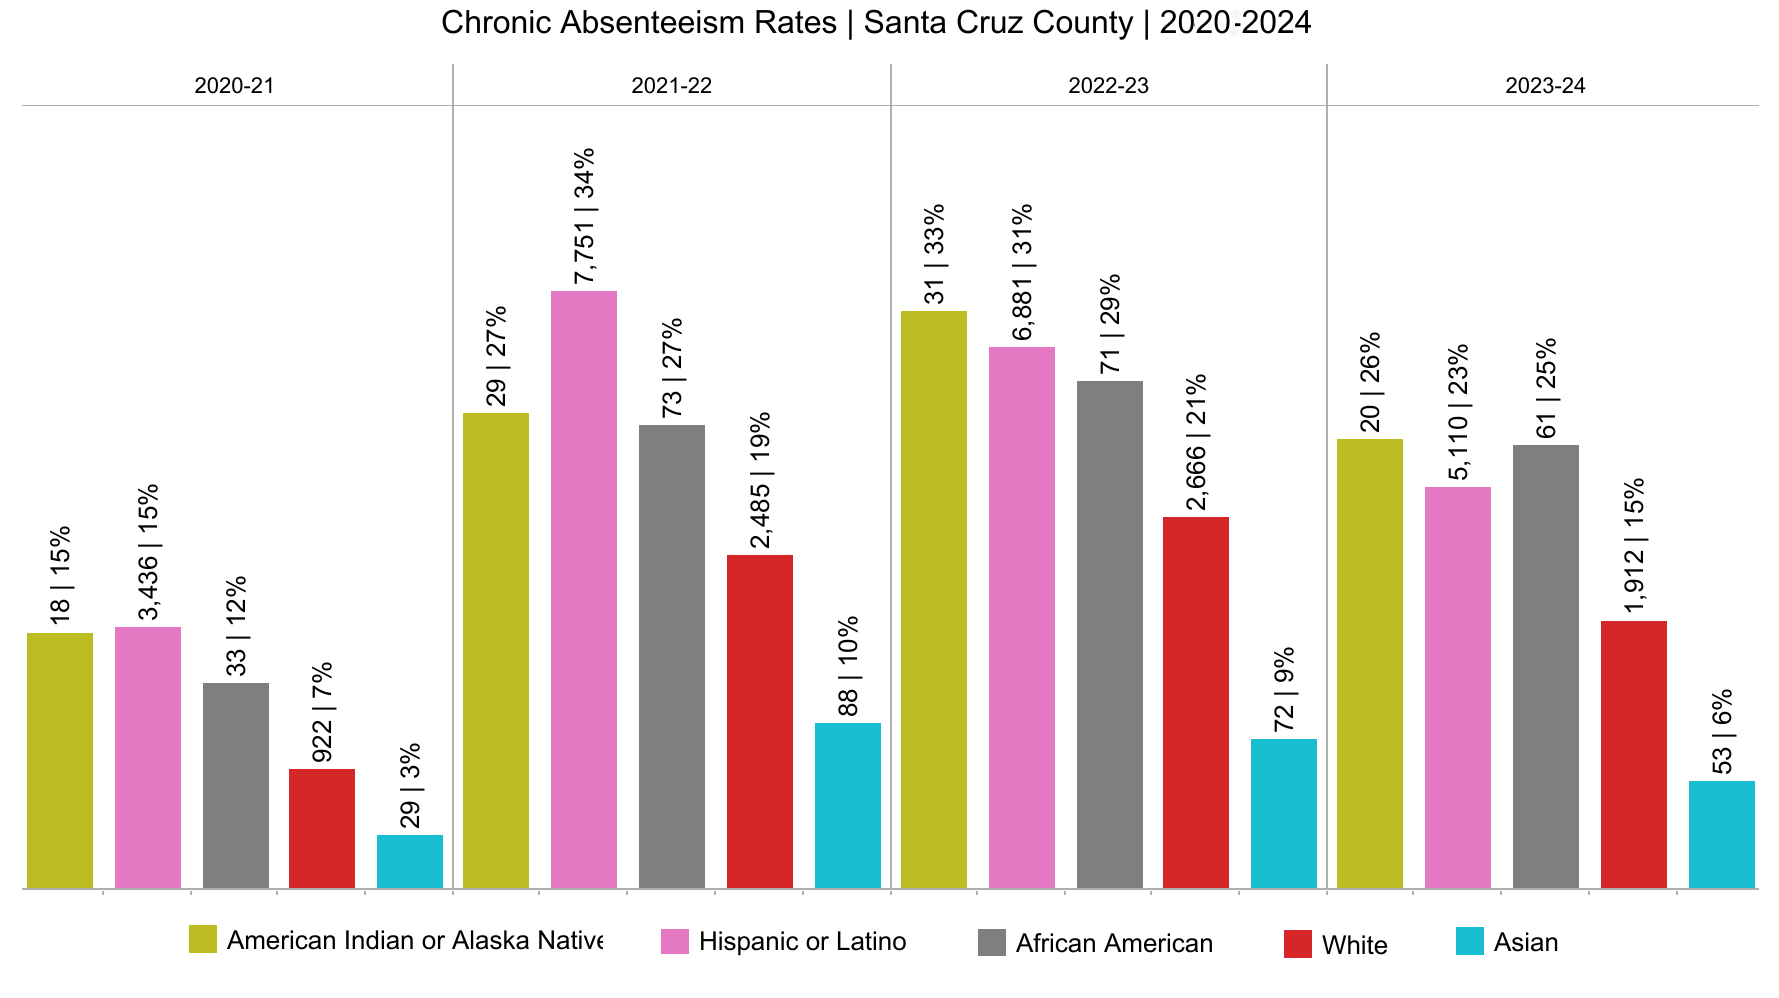
Chronic Absenteism
This chart displays the chronic absenteeism rates among different ethnic groups in Santa Cruz County from 2018 to 2024. Chronic absenteeism is defined as missing 10% or more of school days for any reason. The data shows that absenteeism rates vary significantly across different groups and years. Over the years, each group has experienced fluctuations in absenteeism, with certain trends indicating increased rates post-2020, possibly due to the impacts of the COVID-19 pandemic. American Indian or Alaska Native and Hispanic or Latino students consistently show higher absenteeism rates compared to other groups, highlighting potential areas for targeted intervention and support to improve attendance and, consequently, educational outcomes. This information is crucial for developing strategies that address the specific needs of these communities to foster better engagement and success in school.
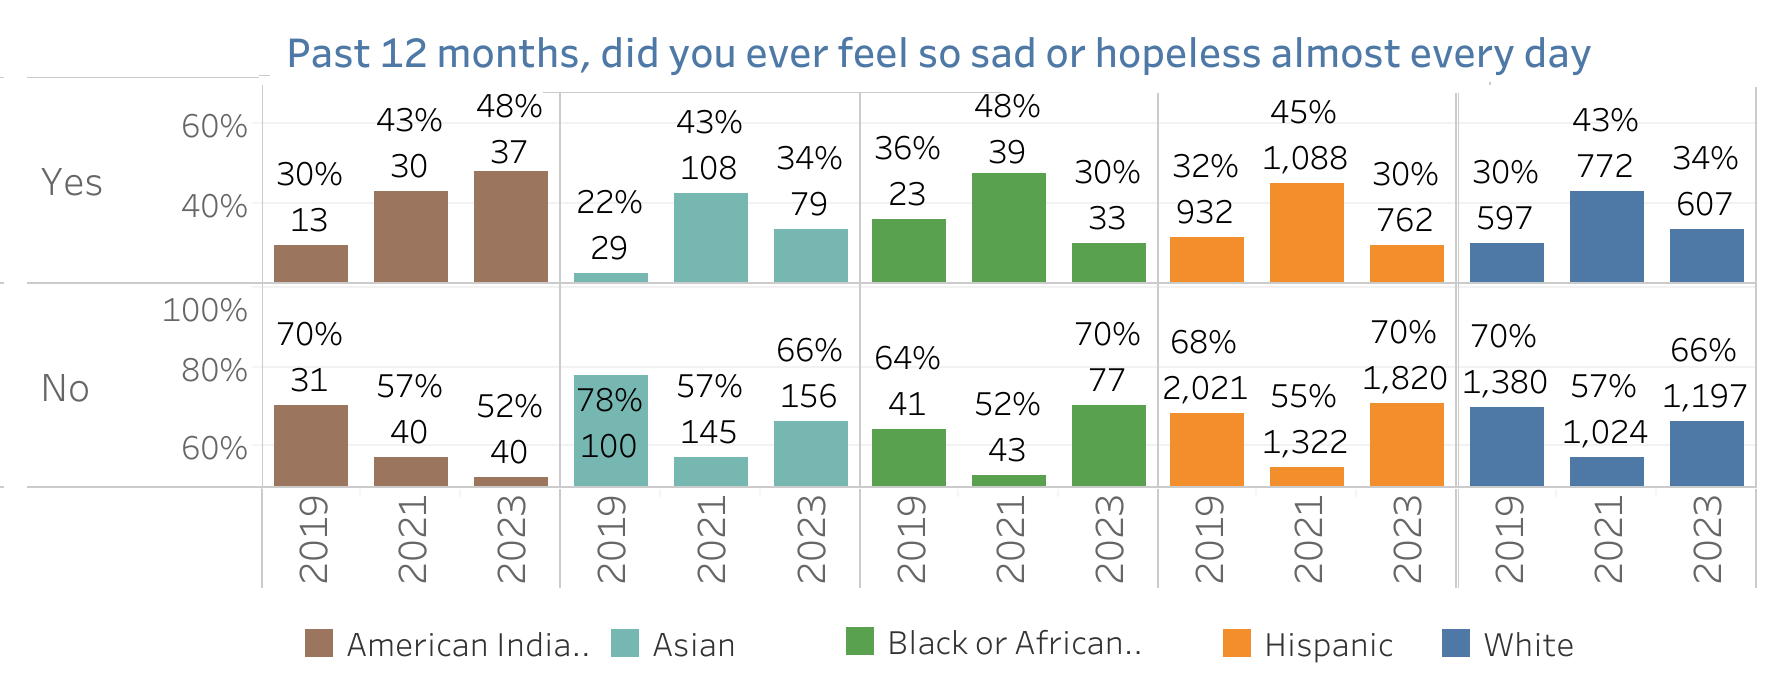
CHKS Survey: Feeling Hopeless
This chart provides a visual breakdown of the responses to a key mental health indicator from the California Healthy Kids Survey, focusing on the frequency of feelings of sadness or hopelessness among students from various ethnic backgrounds over several years. It starkly highlights that a significant portion of students across all groups have experienced these feelings almost every day, with varying rates that sometimes exceed 40% in certain years. Notably, the trend appears consistent across different ethnic groups, suggesting a widespread issue that affects students irrespective of their racial or ethnic background. This data underscores the critical need for enhanced mental health support and resources within schools to address these prevalent issues of sadness and hopelessness among students.
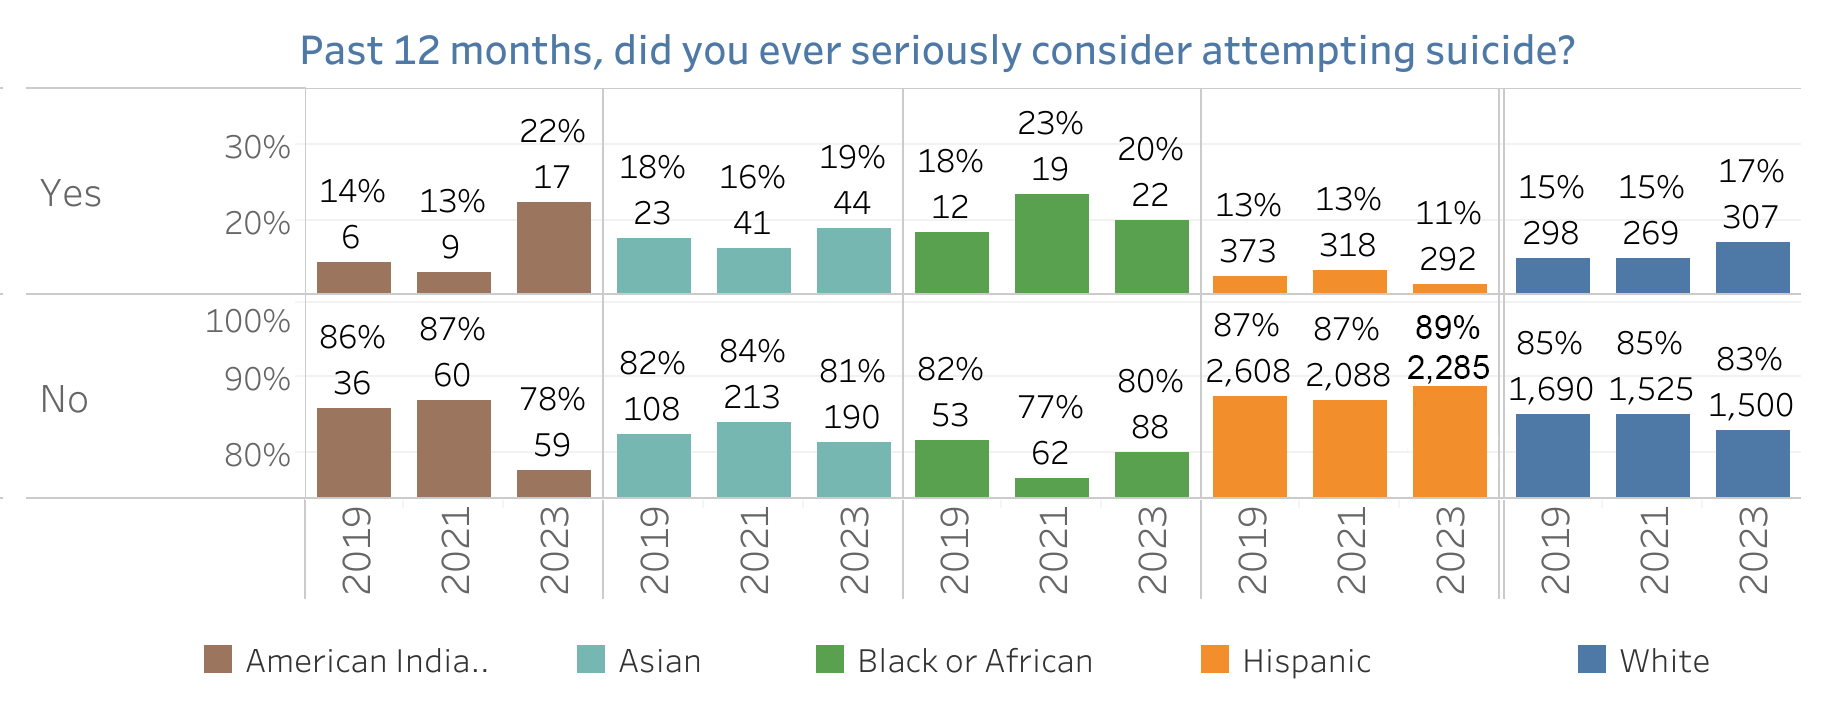
CHKS Survey: Consider Suicide
This chart details responses from the California Healthy Kids Survey concerning students' considerations of suicide over several years, segmented by ethnicity. The data underscores a troubling but important issue: a consistent minority of students across all groups reported having seriously considered attempting suicide, with the percentages typically ranging from 13% to 23% annually. Notably, the Hispanic group showed a higher percentage in some years compared to others. The majority of students, however, reported not having considered suicide, which remains reassuring. Nonetheless, the persistent presence of these considerations across all groups calls for continued and enhanced mental health support in schools to address and mitigate these concerns effectively.
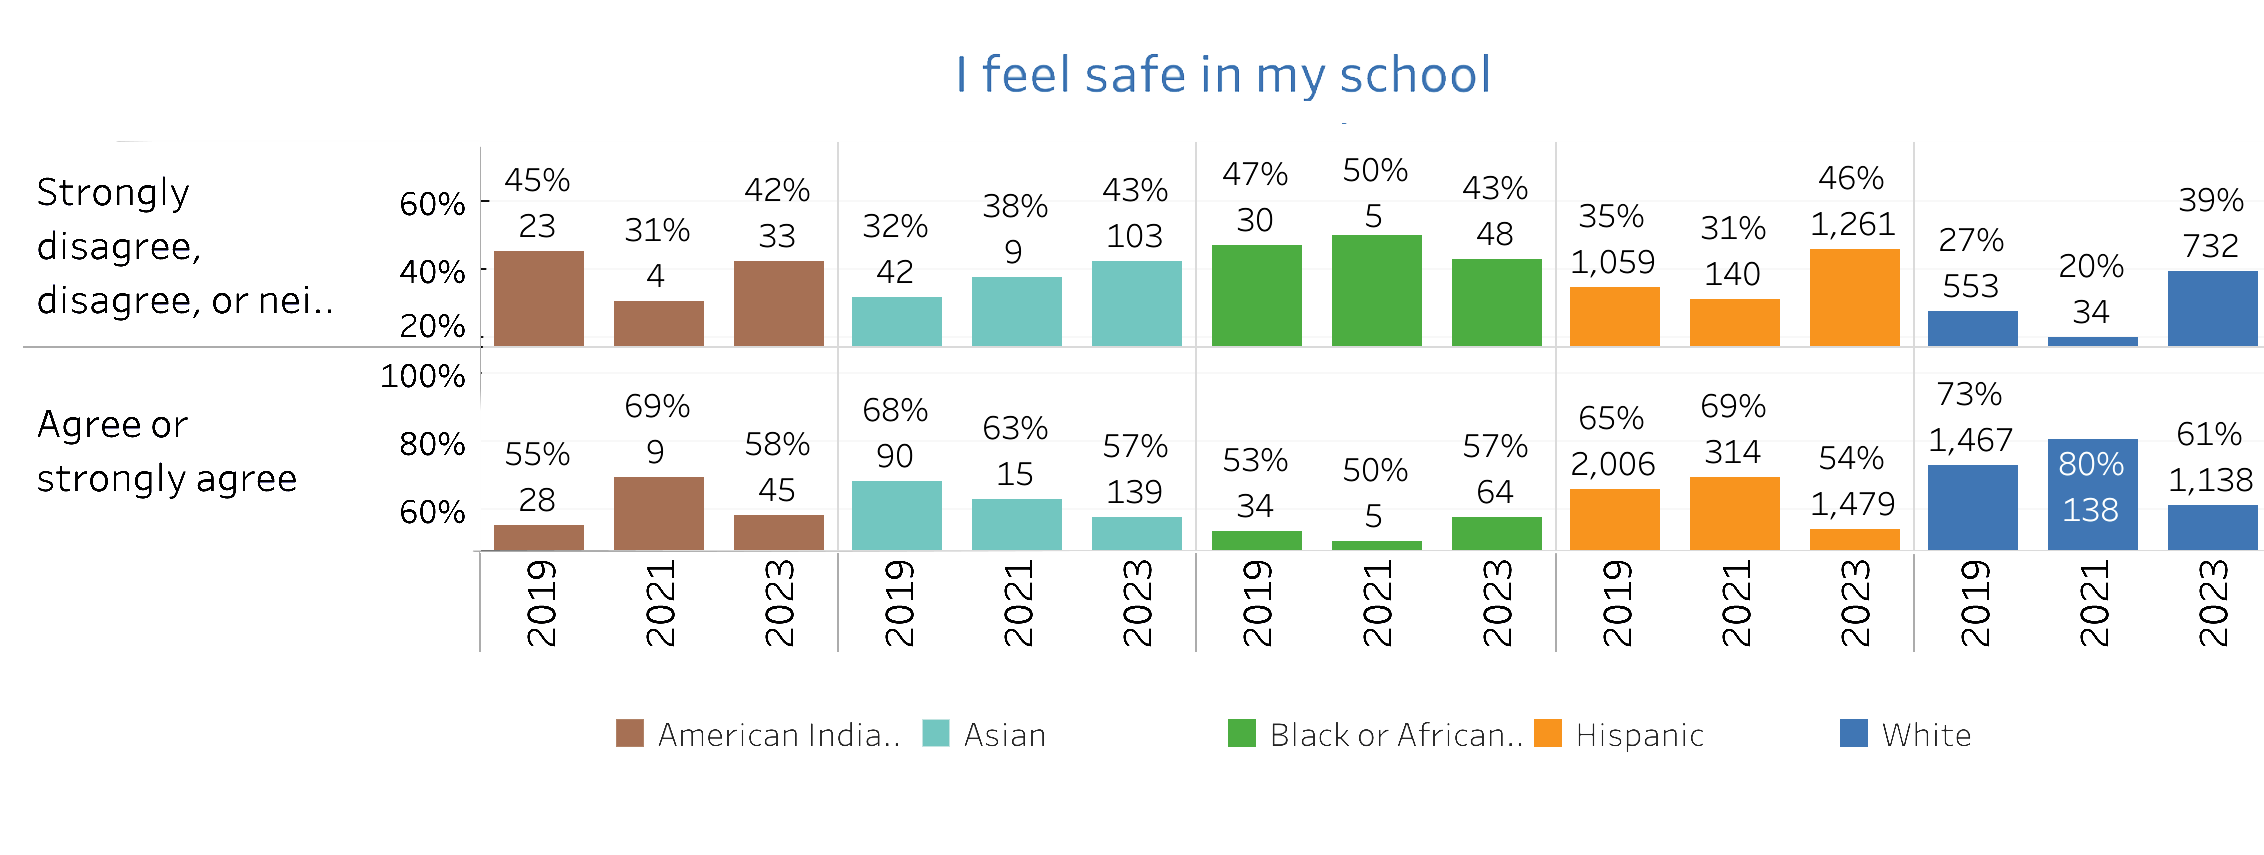
CHKS Survey: Feeling Safe at School
The chart from the California Healthy Kids Survey illustrates student perceptions of safety in school across various ethnic groups from 2019 to 2023. Most student groups consistently reported feeling safe at similar levels, with a majority indicating agreement with feeling safe. However, there were slight declines in the perception of safety over the years for American Indian, Asian, Black, and Hispanic students. White students showed a temporary increase in perceived safety in 2021, but this level dropped again by 2023, aligning with the general trend observed in other groups.